Build: a system monitor
A complete, step-by-step walkthrough — the htop-style monitor, from an empty folder to a running app
This is the long one. We build the htop-style monitor from the examples
end to end — every file, every line — so you can see how the pieces actually fit: a
chart, a Gauge, a BarChart, a sortable
Table, keyboard input, and a live data source, all in one plugin.
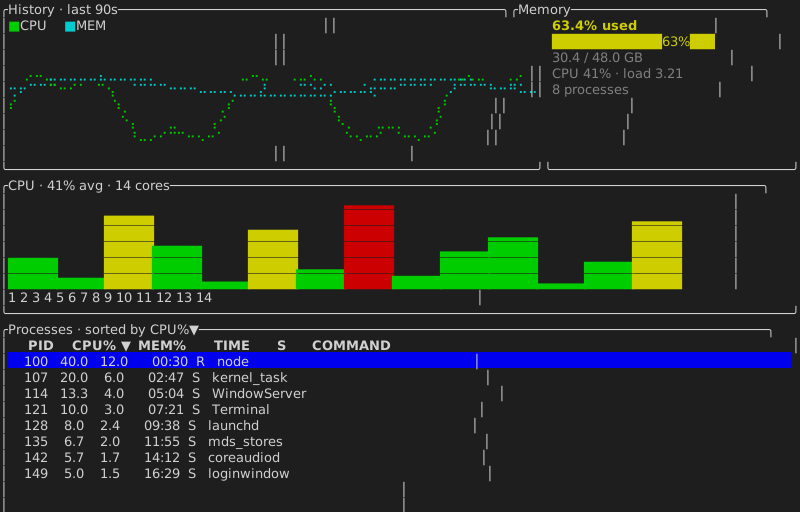
pnpm --filter @uniview/tui-htop-demo dev # the finished resultThe shape
Data flows one way. A sampler reads the machine on a timer and produces an immutable
Frame; the component renders that Frame and owns nothing but view state (which column is
sorted, where the cursor is). Nothing in the component does I/O — that keeps it pure and the
next sample can't fight the user's keypress.
 os.cpus() / ps ──▶ sampler ──▶ Frame ──▶ <App/> ──▶ terminal
   (every 1.5s)                    ▲          │
                                   └─ sort / cursor state (useState)
Four files:
src/sysinfo.ts— the data layer: pure math + parsers, plus the I/O sampler.src/app.tsx— the component: renders aFrame.src/main.tsx— the bootstrap: the terminal driver + the sample timer.tests/sysinfo.test.ts— unit tests for the pure core.
Why real data belongs in a plugin
Reading os.cpus() or shelling out to ps is real I/O. A browser Web Worker plugin can't do
it — but a Node/Bun plugin can, and that is exactly what the bridge runtime is for. The
rendering half is identical either way; only the data source changes.
Step 1 — the data layer
Everything the monitor knows about the machine lives in sysinfo.ts. The trick that keeps it
testable: split the pure math and parsing from the I/O. computeCpuPercent and parsePs
are pure functions of their inputs — no clock, no ps — so a unit test can hand them fixed
data and assert exact numbers.
Types
import { execFileSync } from "node:child_process";
import { cpus, freemem, loadavg, totalmem, type CpuInfo } from "node:os";

export interface Process {
  pid: number;
  cpu: number; // %CPU
  mem: number; // %MEM
  seconds: number; // elapsed seconds, parsed from etime (for sorting)
  etime: string; // elapsed time as displayed
  state: string; // process state code, e.g. "R", "S", "Ss"
  command: string; // executable path (comm)
}

export type SortKey = "pid" | "cpu" | "mem" | "time" | "command" | "state";
export type SortDir = "asc" | "desc";
CPU% is a rate, so it needs two samples
os.cpus() returns cumulative tick counters per core. A single reading tells you nothing;
busy% is the change between two readings: 1 − Δidle / Δtotal. The caller keeps the previous
snapshot and passes both in.
/** Overall busy % between two os.cpus() snapshots. Returns 0 for a zero interval. */
export function computeCpuPercent(prev: readonly CpuInfo[], cur: readonly CpuInfo[]): number {
  let idle = 0;
  let total = 0;
  const n = Math.min(prev.length, cur.length);
  for (let i = 0; i < n; i += 1) {
    const p = prev[i]!.times;
    const c = cur[i]!.times;
    const pt = p.user + p.nice + p.sys + p.idle + p.irq;
    const ct = c.user + c.nice + c.sys + c.idle + c.irq;
    idle += c.idle - p.idle;
    total += ct - pt;
  }
  if (total <= 0) return 0;
  return Math.max(0, Math.min(100, (1 - idle / total) * 100));
}

/** The same, but one busy % per core — this drives the bar chart. */
export function computeCorePercents(prev: readonly CpuInfo[], cur: readonly CpuInfo[]): number[] {
  const n = Math.min(prev.length, cur.length);
  const out: number[] = [];
  for (let i = 0; i < n; i += 1) {
    const p = prev[i]!.times;
    const c = cur[i]!.times;
    const pt = p.user + p.nice + p.sys + p.idle + p.irq;
    const ct = c.user + c.nice + c.sys + c.idle + c.irq;
    const idle = c.idle - p.idle;
    const total = ct - pt;
    out.push(total > 0 ? Math.max(0, Math.min(100, (1 - idle / total) * 100)) : 0);
  }
  return out;
}
Parsing ps
We ask ps for the columns we want, with = empty headers so there is no header row to skip.
Putting comm last matters: a command path can contain spaces, so we split the fixed
columns off the front and keep everything remaining as the command.
/** Parse a ps etime ("[[DD-]HH:]MM:SS") into whole seconds (so TIME sorts numerically). */
export function parseEtime(etime: string): number {
  const dash = etime.indexOf("-");
  const days = dash >= 0 ? Number(etime.slice(0, dash)) : 0;
  const clock = dash >= 0 ? etime.slice(dash + 1) : etime;
  const parts = clock.split(":").map(Number);
  let sec = 0;
  if (parts.length === 3) sec = parts[0]! * 3600 + parts[1]! * 60 + parts[2]!;
  else if (parts.length === 2) sec = parts[0]! * 60 + parts[1]!;
  else sec = parts[0] ?? 0;
  return (Number.isFinite(days) ? days : 0) * 86400 + (Number.isFinite(sec) ? sec : 0);
}

/** Parse `ps -axo pid=,pcpu=,pmem=,etime=,state=,comm=`. Malformed lines are skipped. */
export function parsePs(text: string): Process[] {
  const out: Process[] = [];
  for (const raw of text.split("\n")) {
    const line = raw.trim();
    if (line === "") continue;
    const f = line.split(/\s+/);
    if (f.length < 6) continue;
    const pid = Number(f[0]);
    if (!Number.isFinite(pid)) continue;
    out.push({
      pid,
      cpu: Number(f[1]) || 0,
      mem: Number(f[2]) || 0,
      etime: f[3]!,
      seconds: parseEtime(f[3]!),
      state: f[4]!,
      command: f.slice(5).join(" "), // everything after column 5 — a spaced path stays whole
    });
  }
  return out;
}
Sorting
One comparator, switched on the column. Numeric columns subtract; text columns
localeCompare. sign flips for descending. It never mutates its input (slice().sort), so
re-sorting is a pure derivation from frame.processes.
export function sortProcesses(list: readonly Process[], key: SortKey, dir: SortDir): Process[] {
  const sign = dir === "asc" ? 1 : -1;
  const cmp = (a: Process, b: Process): number => {
    switch (key) {
      case "pid": return (a.pid - b.pid) * sign;
      case "cpu": return (a.cpu - b.cpu) * sign;
      case "mem": return (a.mem - b.mem) * sign;
      case "time": return (a.seconds - b.seconds) * sign;
      case "command": return a.command.localeCompare(b.command) * sign;
      case "state": return a.state.localeCompare(b.state) * sign;
    }
  };
  return list.slice().sort(cmp);
}

/** The last path segment, for a compact COMMAND cell. */
export function commandName(command: string): string {
  const slash = command.lastIndexOf("/");
  return slash >= 0 ? command.slice(slash + 1) : command;
}
The sampler (the only I/O)
createSampler closes over the previous cpu snapshot so each sample() returns a true rate.
This is the one function that touches the outside world.
export interface Snapshot {
  cpu: number;
  cores: number[];
  mem: number;
  memUsedGB: number;
  memTotalGB: number;
  load1: number;
  processes: Process[];
}

const GIB = 1024 ** 3;

export function createSampler(): { sample: () => Snapshot } {
  let prevCpus = cpus();
  return {
    sample() {
      const curCpus = cpus();
      const cpu = computeCpuPercent(prevCpus, curCpus);
      const cores = computeCorePercents(prevCpus, curCpus);
      prevCpus = curCpus; // carry forward for the next rate
      const total = totalmem();
      const free = freemem();
      let processes: Process[] = [];
      try {
        const out = execFileSync("ps", ["-axo", "pid=,pcpu=,pmem=,etime=,state=,comm="], {
          encoding: "utf8",
          maxBuffer: 16 * 1024 * 1024,
        });
        processes = parsePs(out);
      } catch {
        processes = []; // no `ps` (or a locked-down sandbox) — render an empty table
      }
      return {
        cpu,
        cores,
        mem: total > 0 ? (1 - free / total) * 100 : 0,
        memUsedGB: (total - free) / GIB,
        memTotalGB: total / GIB,
        load1: loadavg()[0] ?? 0,
        processes,
      };
    },
  };
}
Step 2 — the component skeleton
The component receives a Frame (the snapshot plus the two history arrays) and the terminal
size, and holds only view state.
import { useState, type ReactElement } from "react";
import { BarChart, Box, Gauge, LineChart, Panel, StatusBar, Table, Text, useInput, type Column } from "@uniview/tui-react";
import { commandName, sortProcesses, type Process, type SortDir, type SortKey } from "./sysinfo";

export interface AppHost {
  quit: () => void;
}

/** One live frame handed down from the sampler in main.tsx. */
export interface Frame {
  cpu: number;
  cores: number[];
  mem: number;
  memUsedGB: number;
  memTotalGB: number;
  load1: number;
  processes: Process[];
  cpuHist: number[]; // overall CPU% history, oldest → newest
  memHist: number[]; // memory% history
}

/** A meter color band: green → yellow → red as utilization climbs. */
function band(pct: number): "green" | "yellow" | "red" {
  return pct >= 85 ? "red" : pct >= 60 ? "yellow" : "green";
}

export function App({ frame, cols, rows, host }: {
  frame: Frame; cols: number; rows: number; host: AppHost;
}): ReactElement {
  const [sortKey, setSortKey] = useState<SortKey>("cpu");
  const [sortDir, setSortDir] = useState<SortDir>("desc");
  const [cursor, setCursor] = useState(0);

  // The displayed order is a pure derivation — no effect, no stored copy.
  const ordered = sortProcesses(frame.processes, sortKey, sortDir);
  const clamped = Math.max(0, Math.min(cursor, ordered.length - 1));

  return (
    <Box flexDirection="column" width="100%" height="100%">
      {/* rows filled in over the next steps */}
    </Box>
  );
}
Why height math, not magic layout
Terminals are a fixed grid, so we budget rows explicitly. The layout below carves the height into three regions and lets the table take the rest:
const available = Math.max(10, rows - 1);              // minus the status bar
const historyH = Math.max(4, Math.min(8, Math.floor(available * 0.26)));
const barsH = Math.max(3, Math.min(7, Math.floor(available * 0.22)));
const row1H = historyH + 3;                            // + legend row + border
const row2H = barsH + 3;                               // + label row + border
const tableHeight = Math.max(3, rows - row1H - row2H - 1);
Step 3 — the history chart
Two series on one LineChart — CPU in green, MEM in cyan — with the y-axis pinned to
0–100 so the plot doesn't rescale as load moves. points are [x, y] pairs; we index the
history array for x.
const histLen = Math.max(frame.cpuHist.length, frame.memHist.length);
const memWidth = Math.min(34, Math.max(24, Math.floor(cols * 0.32)));
const curveWidth = Math.max(20, cols - memWidth - 4);

<Panel title={`History · last ${histLen}s`} flexGrow={1} height={row1H}>
  <LineChart
    series={[
      { points: frame.cpuHist.map((v, i) => [i, v]), color: "green", label: "CPU" },
      { points: frame.memHist.map((v, i) => [i, v]), color: "cyan", label: "MEM" },
    ]}
    options={{
      width: curveWidth,
      height: historyH,
      yBounds: [0, 100],
      xBounds: [0, Math.max(1, histLen - 1)],
      legend: { position: "top" },
    }}
  />
</Panel>
Step 4 — the memory meter
A Gauge draws a filled bar; we overlay the percentage on it with label, and also print it
as bold text so it reads at a glance. band() shifts every color from green to red together.
const memBar = Math.max(6, memWidth - 6);

<Panel title="Memory" width={memWidth} height={row1H}>
  <Box flexDirection="column">
    <Text bold color={band(frame.mem)}>{`${frame.mem.toFixed(1)}% used`}</Text>
    <Gauge
      fraction={frame.mem / 100}
      options={{ width: memBar, color: band(frame.mem), label: `${frame.mem.toFixed(0)}%` }}
    />
    <Text color="gray">{`${frame.memUsedGB.toFixed(1)} / ${frame.memTotalGB.toFixed(1)} GB`}</Text>
    <Text color="gray">{`CPU ${frame.cpu.toFixed(0)}% · load ${frame.load1.toFixed(2)}`}</Text>
    <Text color="gray">{`${frame.processes.length} processes`}</Text>
  </Box>
</Panel>
Wrap Steps 3 and 4 in a <Box flexDirection="row"> so the chart and meter sit side by side.
Step 5 — the per-core bar chart
One bar per core, colored by that core's load. We compute barWidth from the available width
so the bars fill the panel regardless of core count.
const coreArea = Math.max(cols - 4, frame.cores.length * 2);
const barGap = 1;
const barWidth = Math.max(1, Math.floor(coreArea / frame.cores.length) - barGap);

<Panel title={`CPU · ${frame.cpu.toFixed(0)}% avg · ${frame.cores.length} cores`} height={row2H}>
  <BarChart
    data={frame.cores.map((v, i) => ({ label: String(i + 1), value: v, color: band(v) }))}
    options={{
      height: barsH,
      max: 100, // full-height bar = 100%
      barWidth,
      gap: barGap,
      showLabels: frame.cores.length <= 16, // number the cores when there's room
    }}
  />
</Panel>
Step 6 — the sortable table
The Table is controlled: we hand it the already-sorted rows, the selectedIndex, and
per-column definitions. Each Column has a key, a header, and an accessor that turns a
row into its cell string. We fold the sort arrow (▲/▼) into the active column's header, and
pass sort={null} because we did the sorting in sortProcesses — the Table just renders the
order it's given.
const KEY_LABEL: Record<SortKey, string> = {
  cpu: "CPU%", mem: "MEM%", time: "TIME", pid: "PID", command: "COMMAND", state: "S",
};
const arrow = sortDir === "asc" ? " ▲" : " ▼";
const head = (key: SortKey) => KEY_LABEL[key] + (sortKey === key ? arrow : "");

const columns: Column<Process>[] = [
  { key: "pid", header: head("pid"), accessor: (p) => String(p.pid), align: "right", width: 7 },
  { key: "cpu", header: head("cpu"), accessor: (p) => p.cpu.toFixed(1), align: "right", width: 6 },
  { key: "mem", header: head("mem"), accessor: (p) => p.mem.toFixed(1), align: "right", width: 6 },
  { key: "time", header: head("time"), accessor: (p) => p.etime, align: "right", width: 10 },
  { key: "state", header: head("state"), accessor: (p) => p.state, align: "center", width: 4 },
  { key: "command", header: head("command"), accessor: (p) => commandName(p.command), align: "left", minWidth: 10, flexGrow: 1 },
];

<Panel title={`Processes · sorted by ${KEY_LABEL[sortKey]}${arrow.trim()}`} flexGrow={1}>
  <Table
    columns={columns}
    rows={ordered}
    selectedIndex={clamped}
    onSelect={setCursor}
    height={tableHeight}
    width={Math.max(20, cols - 2)}
    sort={null}
  />
</Panel>
The Table virtualizes for free
rows can be thousands long; Table only builds the height rows in view. That's why the
process list stays smooth no matter how busy the machine is.
Step 7 — keyboard input
useInput fires for keys the focused control didn't consume. Letters arrive as printable
input; named keys (ArrowUp, PageDown) arrive as flags on key. The htop convention:
one letter per column, and pressing the same letter again flips the direction.
const pickSort = (key: SortKey) => {
  if (key === sortKey) setSortDir((d) => (d === "asc" ? "desc" : "asc"));
  else {
    setSortKey(key);
    setSortDir(key === "command" || key === "state" ? "asc" : "desc"); // text asc, numbers desc
  }
};

useInput((input, k) => {
  const key = input.toLowerCase();
  if (key === "q") host.quit();
  else if (key === "c") pickSort("cpu");
  else if (key === "m") pickSort("mem");
  else if (key === "t") pickSort("time");
  else if (key === "p") pickSort("pid");
  else if (key === "n") pickSort("command");
  else if (k.upArrow) setCursor(() => Math.max(0, clamped - 1));
  else if (k.downArrow) setCursor(() => Math.min(ordered.length - 1, clamped + 1));
  else if (k.pageUp) setCursor(() => Math.max(0, clamped - tableHeight));
  else if (k.pageDown) setCursor(() => Math.min(ordered.length - 1, clamped + tableHeight));
});
Finish the component with a <StatusBar> footer:
<StatusBar
  height={1}
  items={[
    { label: "sort", keyHint: "C·M·T·P·N" },
    { label: "move", keyHint: "↑↓" },
    { label: "quit", keyHint: "q" },
  ]}
/>
Step 8 — the bootstrap
main.tsx wires the real terminal to the component and runs the sample loop. Two clocks are
at play: the terminal driver (input + resize) and the sample timer (new data every
1.5 s). Sampling is deliberately not per frame — a monitor updates about once a second, and
each sample spawns ps. The history ring buffers live here and ride down as props.
import {
  AnsiCellSurface,
  createTuiReactRoot,
  StyleTable,
  TerminalDriver,
} from "@uniview/tui-react";
import { App, type AppHost, type Frame } from "./app";
import { createSampler } from "./sysinfo";

const HISTORY = 120; // samples kept for the history curve
const INTERVAL_MS = 1500;

const styles = new StyleTable();
const surface = new AnsiCellSurface({ write: (chunk) => process.stdout.write(chunk), styles });
let dim = { width: process.stdout.columns ?? 80, height: process.stdout.rows ?? 24 };
const root = createTuiReactRoot({ surface, styles, size: dim });

const sampler = createSampler();
const cpuHist: number[] = [];
const memHist: number[] = [];
let frame: Frame | null = null;

let timer: ReturnType<typeof setInterval> | null = null;
const host: AppHost = {
  quit: () => {
    if (timer) clearInterval(timer);
    root.destroy();
    driver.stop();
    process.exit(0);
  },
};

const paint = () => {
  if (frame) root.render(<App frame={frame} cols={dim.width} rows={dim.height} host={host} />);
};

const takeSample = () => {
  const snap = sampler.sample();
  cpuHist.push(snap.cpu);
  memHist.push(snap.mem);
  if (cpuHist.length > HISTORY) cpuHist.shift();
  if (memHist.length > HISTORY) memHist.shift();
  frame = { ...snap, cpuHist: [...cpuHist], memHist: [...memHist] };
  paint();
};

const driver = new TerminalDriver({
  input: process.stdin,
  output: process.stdout,
  onEvent: (event) => {
    if (event.type === "resize") {
      dim = { width: event.width, height: event.height };
      root.host.renderer.resize(dim);
      paint();
    } else if (event.type === "key" && event.ctrl && event.key === "c") {
      host.quit();
    } else {
      root.dispatchInput(event); // keys reach <App>'s useInput
    }
  },
});

driver.start();
timer = setInterval(takeSample, INTERVAL_MS);
takeSample(); // prime the first frame immediately
The first CPU frame reads ~0
createSampler snapshots the counters at construction; the very first sample() differences
over a near-zero interval, so CPU shows ≈0 for one frame and corrects on the next tick.
Memory, load, and the process list are correct immediately.
Step 9 — test the pure core
Because the math and parsing are pure, the tests never touch the machine — they feed fixed inputs and assert exact outputs. This is the payoff of keeping I/O in one place.
import { describe, expect, it } from "vitest";
import type { CpuInfo } from "node:os";
import { computeCpuPercent, parseEtime, parsePs, sortProcesses } from "../src/sysinfo";

const core = (user: number, sys: number, idle: number): CpuInfo => ({
  model: "test", speed: 1, times: { user, nice: 0, sys, idle, irq: 0 },
});

describe("computeCpuPercent", () => {
  it("is the busy fraction of the delta between snapshots", () => {
    // 10 ticks elapsed, 3 idle → 70% busy.
    expect(computeCpuPercent([core(0, 0, 0)], [core(5, 2, 3)])).toBeCloseTo(70, 6);
  });
});

describe("parsePs", () => {
  it("keeps a spaced command path whole", () => {
    const [p] = parsePs("  900   0.0  0.0 01-02:00:00 S  /Applications/Google Chrome.app/…/Google Chrome Helper");
    expect(p!.command).toContain("Google Chrome Helper");
    expect(p!.seconds).toBe(1 * 86400 + 2 * 3600);
  });
});

describe("sortProcesses", () => {
  const rows = parsePs("1 90 3 3:20 R alpha\n2 40 2 0:50 S charlie\n3 5 1 0:10 S bravo");
  it("sorts cpu descending", () => {
    expect(sortProcesses(rows, "cpu", "desc").map((p) => p.cpu)).toEqual([90, 40, 5]);
  });
});
pnpm --filter @uniview/tui-htop-demo testRun it
pnpm --filter @uniview/tui-htop-demo dev↑/↓ move the cursor, C / M / T / P / N sort by CPU / memory / time / PID / name
(press again to flip), q quits.
What to take away
- One-way data flow. The sampler makes an immutable
Frame; the component renders it and owns only view state. Re-sorting is a pure derivation, so a keypress never races the next sample. - I/O in one place. All the machine reads live in the sampler; the math and parsing are pure, which is what makes the tests trivial.
- No new primitives. A chart, a gauge, a bar chart, a table, and a status bar — every one is an existing component. Building an app is composition, never a renderer change.
- The same code renders to an image. Swap
AnsiCellSurfaceforSvgCellSurfaceand the identical tree yields the SVG at the top of this page — see Exporting a frame.