Examples
Runnable demos — ports of real terminal apps — and how the screenshots are made
lazygit — in both frameworks
pnpm --filter @uniview/tui-lazygit-demo  dev   # React
pnpm --filter @uniview/tui-lazygit-solid dev   # Solid
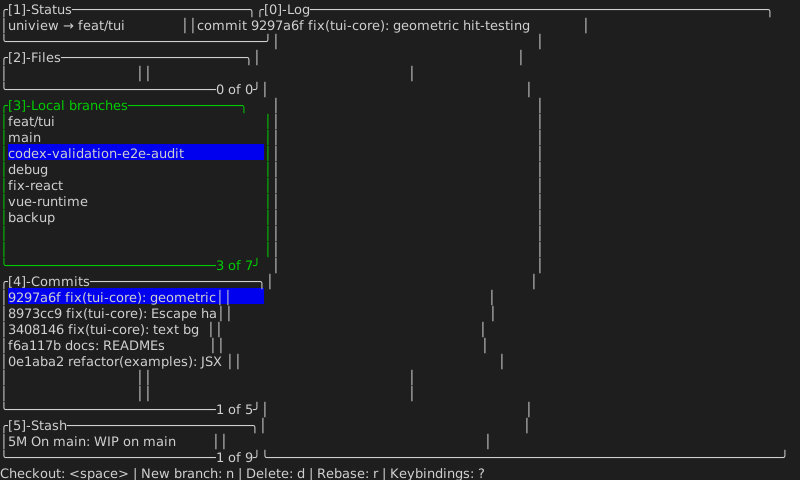
The same application, written twice. 1–5/0 focus a panel; ↑/↓ move the branch or
commit selection; the log panel mirrors the selected commit.
These two exist to be compared. Their rendered frames are byte-identical — the proof that the framework sits above the renderer, not inside it.
Charts — an oha-style dashboard
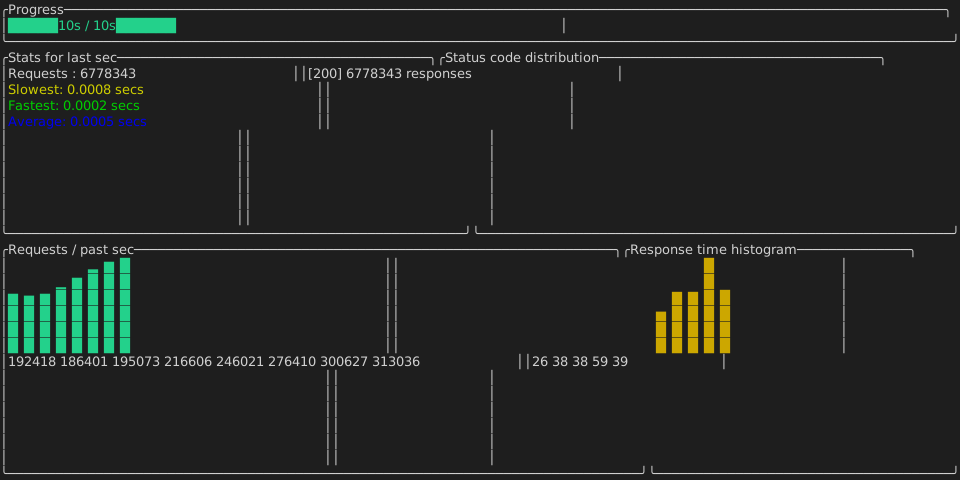
pnpm --dir examples/tui/charts-demo devA simulated load test: gauge, bar chart, histogram, and live stats.
2048 — played by a trained agent
pnpm --filter @uniview/tui-2048 build
pnpm --filter @uniview/tui-2048 start
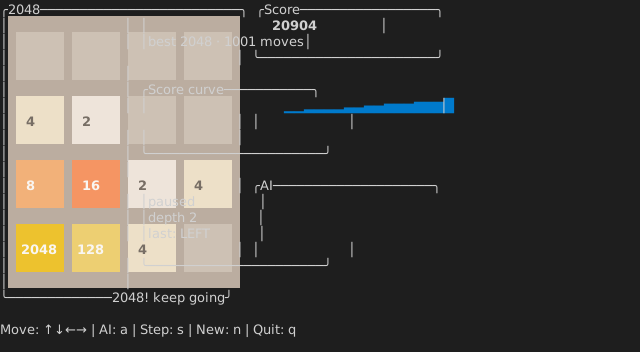
↑↓←→ to play, a to hand it to the AI, s to step it once, +/- for search depth.
The AI is not a heuristic. It is an n-tuple network (5 patterns, 8-way dihedral symmetry,
~84 MB of trained weights) driving expectimax over afterstates. At depth 1 it reaches 2048;
at depth 2 it reaches 4096. The engine is verified against the reference implementation —
816 golden move cases, and V(board) reproduced across six different grid shapes.
The weights are not in the repository. The game runs without them — it is fully playable by hand, and the AI panel simply says so.
Note what the board is made of: colored Boxes and centered Text, and the score curve is
the same Sparkline the charts demo uses. A game needed no new render primitive.
Ports of real terminal apps
The next five re-implement well-known Rust/ratatui TUIs as uniview plugins, to prove the framework carries a real app. Every one is pure plugin code — zero renderer changes — and each keeps its interesting logic in a small, pure, unit-tested core.
htop — a live system monitor
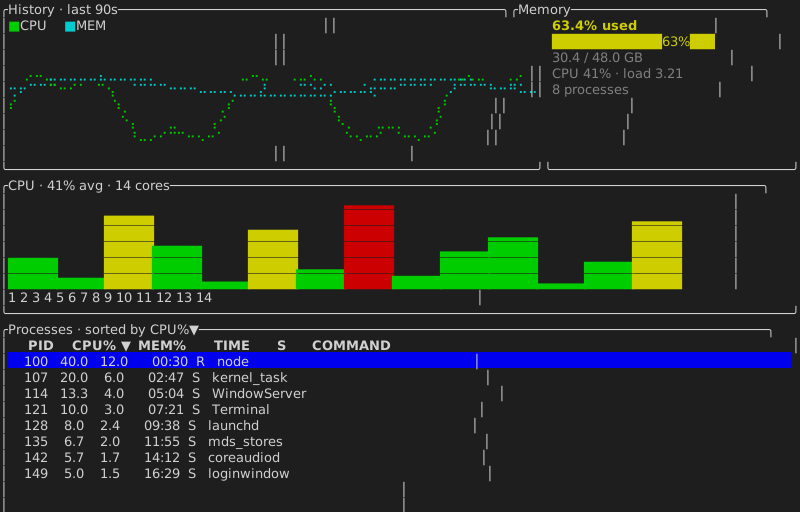
pnpm --filter @uniview/tui-htop-demo dev↑/↓ move; C / M / T / P / N sort the table by CPU, memory,
time, PID or name (press again to flip). A CPU/MEM history LineChart and a memory
Gauge sit above a per-core BarChart and a sortable, virtualized Table.
The data is real — CPU% from differencing os.cpus() snapshots, memory from
os.freemem()/totalmem(), processes from ps — sampled on an interval. That is
exactly the Node/Bun bridge-plugin story: a sandboxed Worker can't read these,
a plugin with real I/O can. The parsing and math (computeCpuPercent, parsePs,
sortProcesses) are pure and unit-tested.
scope — an audio oscilloscope
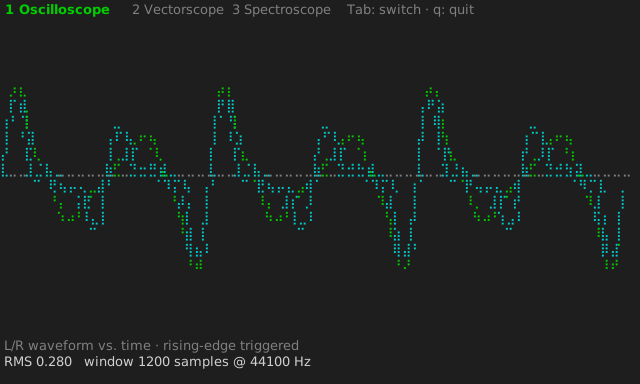
pnpm --filter @uniview/tui-scope-demo devModelled on scope-tui. Tab (or 1/2/3) switches between oscilloscope,
vectorscope and spectroscope, each drawn on a braille Canvas fed by a synthetic
stereo signal. The frame loop is useAnimation() over the host frame clock —
every frame regenerates the signal and repaints locally, no per-frame RPC. The
DSP (a hand-rolled radix-2 FFT + Hann window) is pure and tested against a naive DFT.
csv — less for CSV
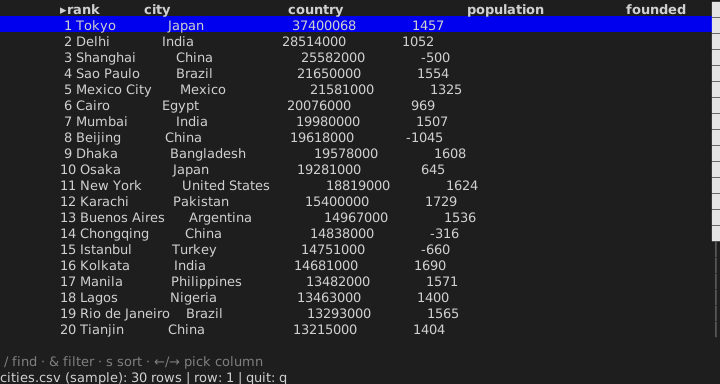
pnpm --filter @uniview/tui-csv-demo dev                 # bundled sample
pnpm --filter @uniview/tui-csv-demo dev -- data.csv     # a real file
A csvlens-style pager. ←/→ pick the sort column (marked ▸), s sorts it,
/ finds by regex (n/N to jump), & filters rows. It reuses the framework
Table nearly as-is — virtualized rows, column layout, a cursor — with the CSV
parser and natural-order comparator as a pure, tested core.
openapi — an API explorer
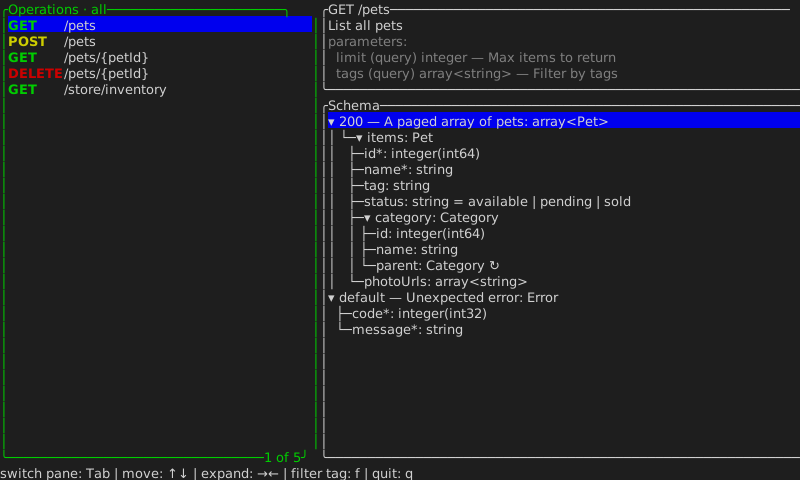
pnpm --filter @uniview/tui-openapi-demo devA browse-only openapi-tui. Tab switches panes, ↑/↓ move, →/← expand a
schema node, f filters by tag. The heart is a collapsible JSON-Schema Tree with
inline $ref drill-down and a cycle guard (Category.parent ↻), built by a pure
schemaToTree converter over a bundled Petstore spec.
image — a raster viewer
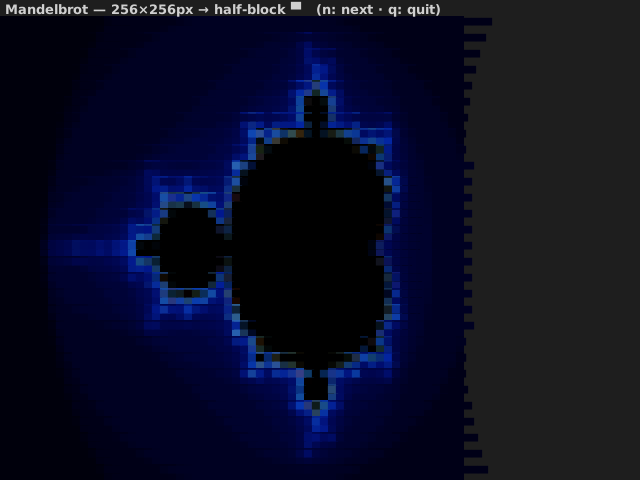
pnpm --filter @uniview/tui-image-demo dev                    # synthetic gallery
pnpm --filter @uniview/tui-image-demo dev -- photo.png       # a real image
An RGBA raster painted as half-block ▀ cells — fg = the upper pixel, bg = the
lower pixel, two pixels per cell at full truecolor. This is the universal,
protocol-free image path (the fallback yazi/chafa use), and it needs no new
primitive: it emits the same styled-lines tree as the charts. Real files decode via
Bun.Image + pngjs.
How these screenshots are made
Each example has a snapshot script. It runs the real application and swaps exactly one
line — AnsiCellSurface becomes SvgCellSurface — then writes toSVG() into
docs/public/tui/.
pnpm --filter @uniview/tui-2048 snapshot
# wrote docs/public/tui/2048-solid.svg (17481 bytes, won=true, score=20904)
So the images are real frames of the real component tree, not mock-ups that can quietly drift from the code. They are SVG, so they stay crisp at any zoom — and being cells, they are also just text underneath.
Snapshots are seeded where the app is random (2048 picks its spawns from an injected RNG), so re-running the script does not churn the diff.